Plotting
Table of Contents
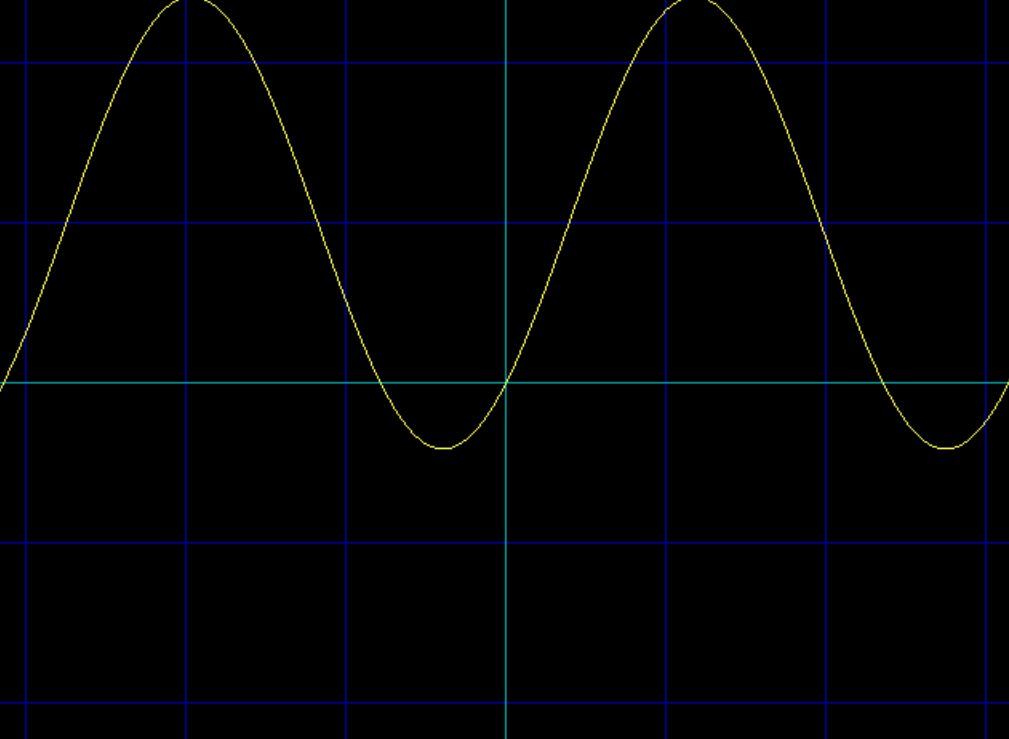
1. 2D graph
The 2D Graph Plotter is a simple yet effective program written in QBasic that allows users to plot mathematical functions on a two-dimensional grid. This program is particularly useful for visualizing mathematical functions and understanding their graphical representations.
The main loop of the program calculates the y-value for each x-value based on a user-defined mathematical function.
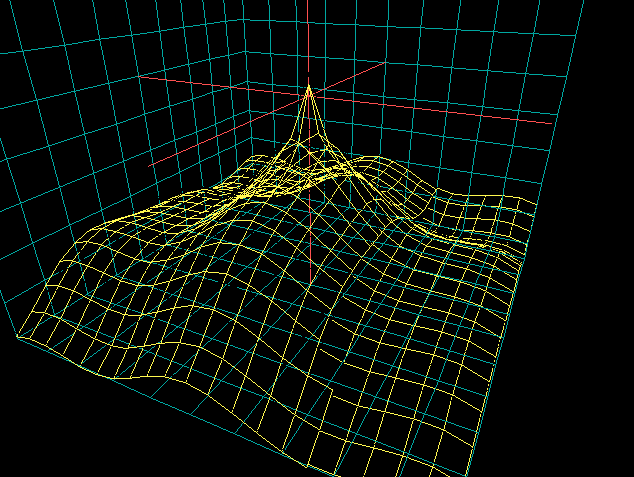
2. 3D graph
The 3D Heightmap Explorer is a QBasic program designed to visualize mathematical functions in three dimensions. It allows users to explore various heightmaps by defining custom formulas and observing their graphical representations. This program is particularly useful for educational purposes, helping users understand complex mathematical surfaces.
Users can navigate through the 3D space using keyboard controls to move around and inspect the heightmap from different angles.
The core of the program is the formula subroutine, where users can define their mathematical functions. Multiple example formulas are provided, which can be enabled or disabled to create different visual effects.
The program includes a grid system that helps users perceive the scale and orientation of the 3D space. This includes background grids and a central 3D cross to indicate the zero point.
The formula subroutine evaluates the user-defined mathematical function to determine the height (Z-coordinate) of each point on the grid.
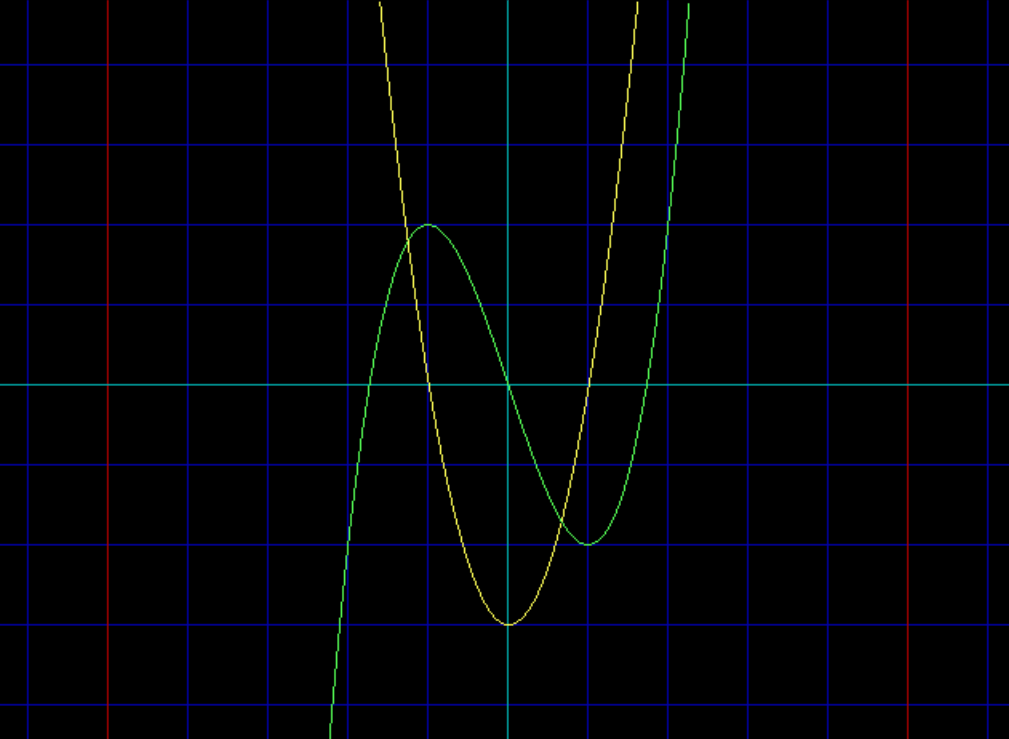
3. Deriviative calculator
This QBasic program is designed to compute and plot an arbitrary mathematical function on a 2D graph. Additionally, it calculates and plots the derivative of the function, providing a visual representation of both the function and its rate of change. The program is a great educational tool for those interested in understanding how mathematical functions and their derivatives can be visualized.
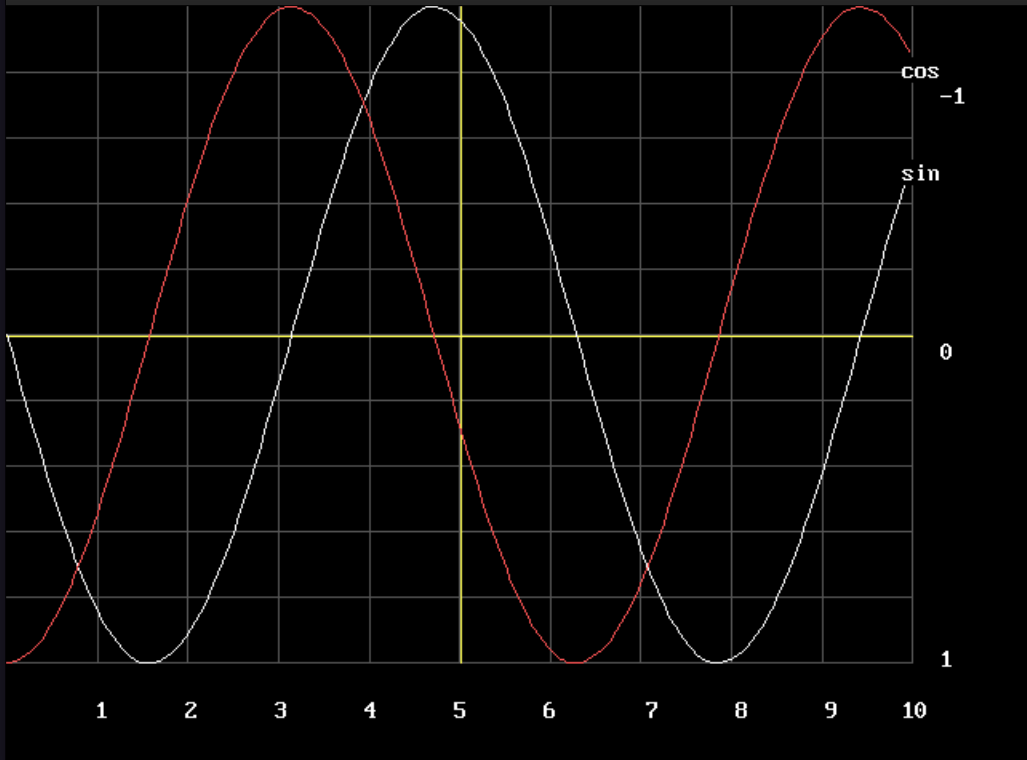
4. Sine and cosine table
The SIN & COS Table Generator is a QBasic program designed to visually plot the sine and cosine functions on a graphical screen. This program is particularly useful for educational purposes, providing a clear visual representation of these fundamental trigonometric functions.