Simulation
Table of Contents
Back to BASIC applications collection
1. Explosion simulator
This QBasic program simulates the propagation of shock waves in a gas within a confined space. It models the behavior of pressure and velocity in a two-dimensional grid, providing a visual representation of how shock waves interact with boundaries and each other.
The program initializes a 100x100 grid to represent pressure and velocity values. It sets up initial conditions, including placing pressure disturbances and defining boundary walls.
The core of the program is a loop that continuously updates the pressure and velocity values. The velocities in the horizontal and vertical directions are updated based on pressure differences between adjacent grid points. The program checks for and corrects negative pressure values to ensure physical realism. The pressure grid is updated based on the current velocities. The program handles boundary conditions by setting velocities to zero at wall boundaries.
The 100x100 pressure grid drawn pixel-by-pixel in the top-left corner: the quiet gas shows as gray, and the high-pressure block seeded on the left detonates into a shock front that sweeps right in red, green and yellow bands. The dark red frame and the diagonal lines are solid walls that zero the local velocities, so the wave reflects off the boundary and funnels through the obstacle field before diffusing. The number printed at the bottom is the negative-pressure residual the correction loop is damping out.
2. Gravity in 2D
The Gravitation Simulation program is a simple yet insightful QBasic application that simulates the gravitational interaction between a central mass and an orbiting object in a two-dimensional space. This program provides a visual representation of how gravitational forces influence the motion of celestial bodies, making it an excellent educational tool for understanding basic orbital mechanics.
The large cyan circle is the central mass and the tiny yellow dot the orbiting object, which leaves a dotted trail as it loops around. A dark blue line connects the object to the center every frame. Because the pull falls off as 1/distance rather than 1/distance^2, the orbit never closes: it precesses into a slowly rotating three-lobed rosette, and the accumulated radius lines weave the dense blue web filling the interior. Any key press exits.
3. Gravity in 3D
This QBasic program simulates the gravitational interactions between spheres in a three-dimensional space. It provides a visual representation of how spheres might move under the influence of gravitational forces, offering an educational insight into basic physics principles.
When spheres are far apart, gravity is dominating force. When Distance between spheres crosses critical threshold, much stronger repulsive force emerges and becomes dominant.
There is also friction. This ensures that after some bouncing, spheres will reach stable configuration.
Thirty white circles — perspective-projected spheres whose drawn radius shrinks with depth — start at random positions and fall toward each other. The pairwise force follows 1/(d-1), so it attracts at range but flips into a strong repulsion once two spheres close in past the critical distance, and dividing the velocities by 1.01 every step bleeds off energy. The swarm collapses, bounces, and settles into the compact overlapping cluster seen at the center of the screen.
4. Interference
This QBasic program simulates the interference pattern created by two sine waves with slightly different frequencies. It visually demonstrates how wave interference works, which is a fundamental concept in physics and engineering, particularly in the study of sound, light, and other wave phenomena.
Program combines two waves to create an interference pattern, which is displayed as a third waveform.
Two traveling sine waves scroll across the upper part of the screen: the blue one is a plain SIN(frame + x/4), while the green one carries an extra phase shift that grows with x, so the two slide in and out of phase along the axis. The white waveform below is their point-by-point sum, and its periodically swelling and collapsing amplitude envelope is the classic beating pattern of two slightly detuned frequencies.
5. Interferogram
This QBasic program simulates the interference pattern created by multiple frequencies interacting with each other. The result is a visual representation known as an interferogram, which is commonly used in physics and engineering to analyze wave interactions.
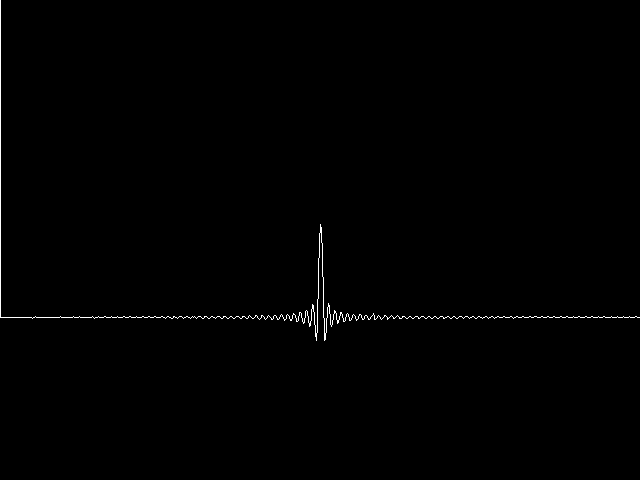
A single white line on black. For every horizontal pixel the program sums |SIN(t) + SIN(k*t)| over 5000 time steps, with the detune factor k sweeping linearly around 1 from left to right. Where the frequencies differ, the sum settles into a low, finely rippled baseline; at the exact center k = 1 and the two waves coincide perfectly, so the accumulated amplitude spikes into a tall narrow pulse with symmetric ringing side lobes — the signature shape of an interferogram.
6. Surface tension
This QBasic program simulates the behavior of water spills and the subsequent effects of surface tension using cellular automata rules. The simulation models how water spreads and how surface tension affects the shape of the water body, particularly smoothing out sharp edges over time.
The main loop continuously calculates the next state of each cell based on the surface tension rules. It uses the Moore neighborhood, which includes all eight surrounding cells, to determine the state of each cell in the next iteration.
The rules dictate that a water cell survives only if surrounded by a moderate density of other water cells, while an empty space becomes a water cell if surrounded by a high density of water cells.
An 80x50 text-mode screen where "#" cells are water and "." cells are empty. The simulation starts from pure random noise, and the Moore-neighborhood rules — a water cell survives only with more than three neighbors, an empty cell fills in with more than four — act like surface tension: isolated specks evaporate, ragged edges get smoothed, and the liquid gathers into the rounded, slowly wandering blobs visible here.
7. Wave 1
This QBasic program simulates the propagation of waves across a surface. It provides a visual representation of wave dynamics, which can be both educational and a source of inspiration for those interested in physics simulations or algorithmic art.
The program updates the velocity and height of each point based on the calculated averages, applying a damping factor to simulate energy loss.
A filled white water column on a black background, initially given a rectangular bump in the middle. The bump collapses under the neighbor-averaging update and sends ripples racing out toward both walls; with the velocity damped by 1.01 per step, the sloshing gradually calms and the surface settles back toward flat. The height array drives both the black clearing lines above the surface and the white fill below it.
8. Wave 2
This QBasic program simulates and visualizes the behavior of water waves on a 2D surface. It creates a dynamic animation of water disturbed by random rain droplets, demonstrating how waves propagate and interact with each other. The program is an example of a simple physics simulation and can serve as an educational tool for understanding wave mechanics.
A thin white wave line across a black screen, drawn point by point from the surface height array. Random rain droplets keep kicking the surface: each impact injects a half-sine splash of random width and amplitude, and the neighbor-averaging propagation with light damping spreads the disturbance into clean traveling ripples that cross, superimpose, and fade.